The quality dashboard that turns “I think the team is struggling” into “I know exactly what’s going wrong and how to fix it.”
The Problem
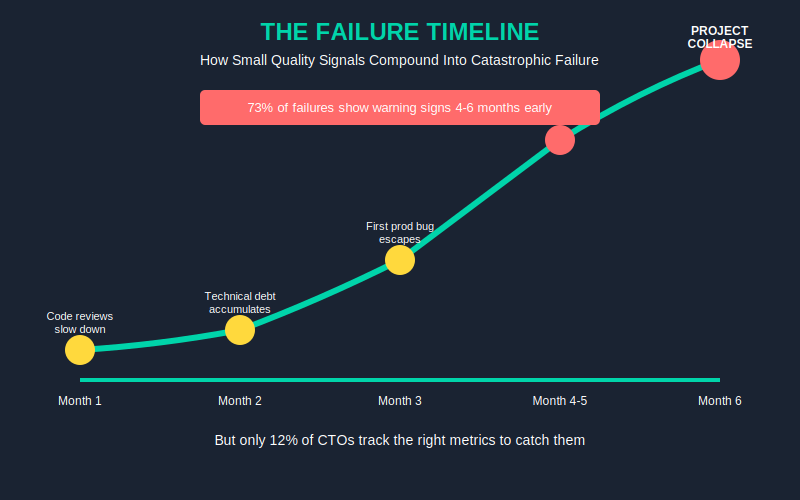
73% of offshore engagements that fail show warning signs 4-6 months before project collapse — but only 12% of CTOs track the right metrics to catch them.
Here’s what happens in real companies: You inherited an offshore team. Everything looks fine on standups. Sprint velocity is stable. Then one Tuesday, production goes down because a critical bug slipped through — and when you dig in, you discover the codebase has been rotting for months. The team lead quit three weeks ago. Code reviews stopped happening. No one told you.
Most CTOs manage offshore teams with gut feel and sprint velocity. They notice quality problems when it’s already too late — missed deadlines, production bugs, key devs quitting. By then, you’ve lost 6 months and $150K+ in rework.
The Hidden Cost
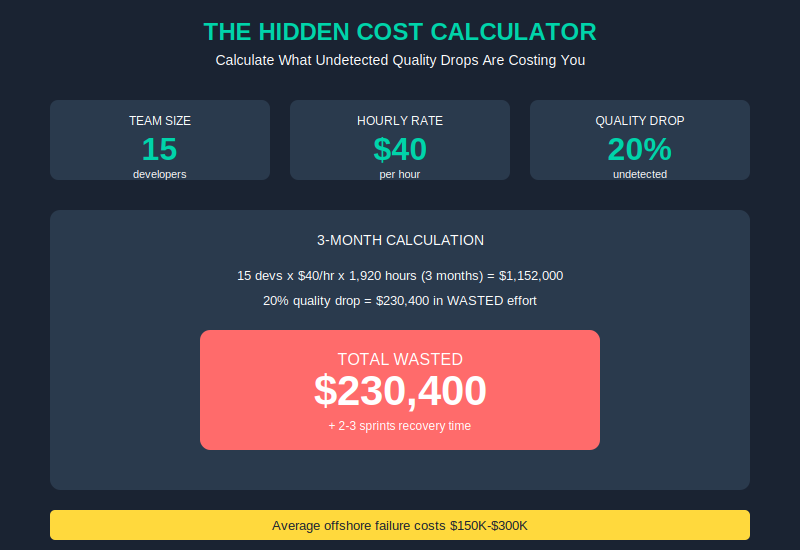
Average offshore team failure costs $150K-$300K. That’s not just rehiring fees — it’s rework, lost momentum, opportunity cost, and the internal bandwidth your team burns managing the mess.
Let’s make it concrete. If your offshore team has 15 devs at $40/hr, and quality drops 20% undetected for 3 months:
- 15 devs × $40/hr × 1,920 hours (3 months) = $1,152,000 in total developer time
- 20% quality drop = $230,400 in wasted effort on code that gets rewritten
- Plus the 2-3 sprints of recovery once you discover the problem
That’s a $200K mistake. And it happens because nobody was watching the signals.
The Solution Framework
The fix is simple: watch the right metrics. Not just velocity — which tells you almost nothing about quality. Not just “are we shipping” — which hides a multitude of sins.
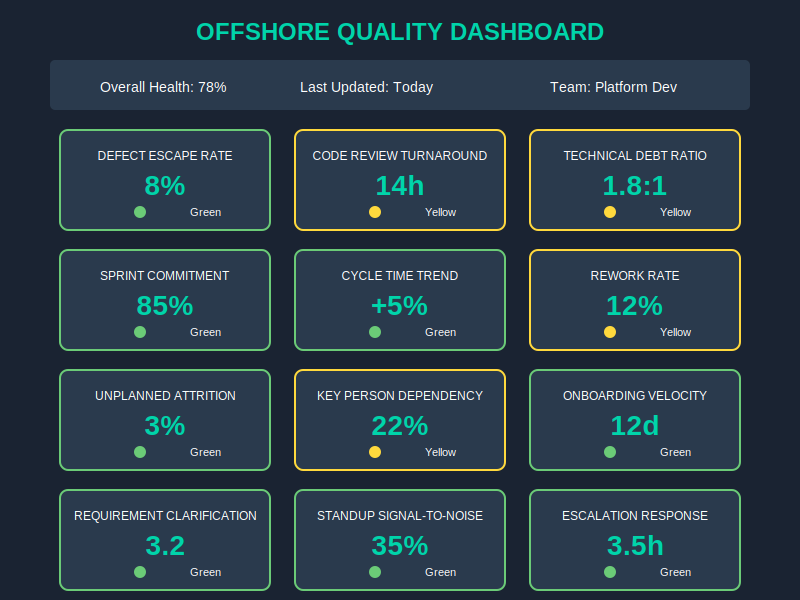
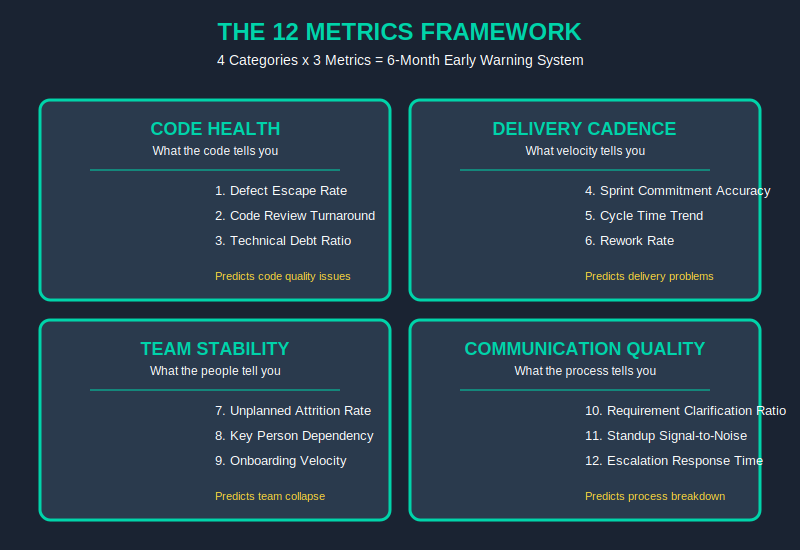
You need a dashboard that tracks 12 signals across 4 categories:
- Code Health — what the code tells you
- Delivery Cadence — what the velocity tells you
- Team Stability — what the people tell you
- Communication Quality — what the process tells you
Every category has 3 metrics. Together, they give you a 6-month early warning system. Not vague “team seems off” — actual data points that predict failure before it happens.
The Technical How — The 12 Metrics Deep Dive
Here’s the full blueprint. Each metric has a formula and threshold. Use these as your baseline — adjust for your team size, but don’t ignore the red flags.
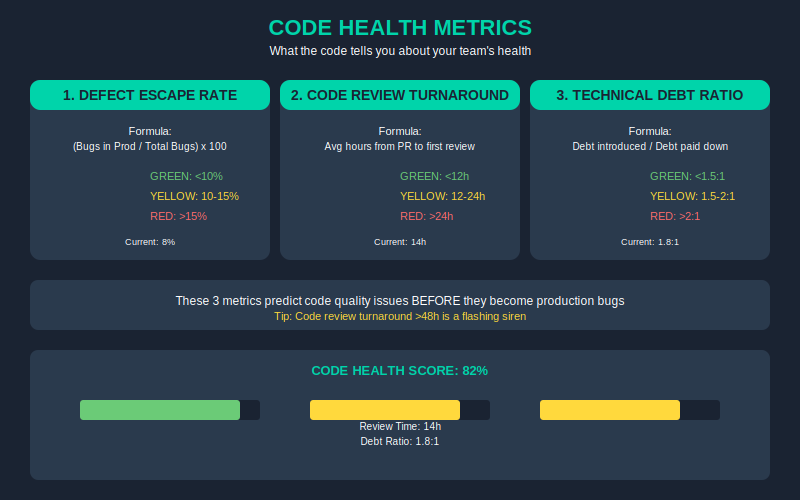
Code Health
1. Defect Escape Rate
- Formula: (Bugs found in production / Total bugs found) × 100
- Green: <10% | Yellow: 10-15% | Red: >15%
- If more than 15% of your bugs are escaping to production, your QA process is broken.
2. Code Review Turnaround
- Formula: Average hours from PR submitted to first meaningful review comment
- Green: <12h | Yellow: 12-24h | Red: >24h
- Slow reviews = technical debt accumulation. >48h is a flashing siren.
3. Technical Debt Ratio
- Formula: (Debt introduced this sprint / Debt paid down this sprint)
- Green: <1.5:1 | Yellow: 1.5-2:1 | Red: >2:1
- If you’re adding debt 2x faster than you’re paying it down, you’re building on sand.
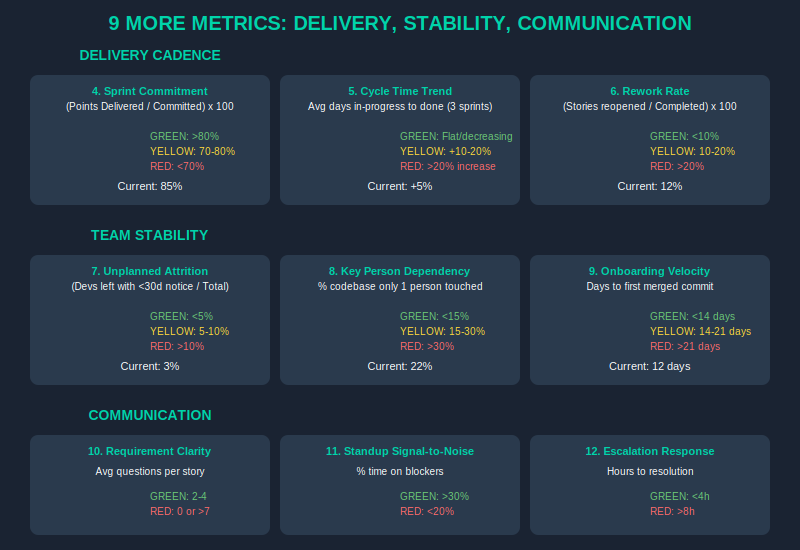
Delivery Cadence
4. Sprint Commitment Accuracy
- Formula: (Points delivered / Points committed) × 100
- Green: >80% | Yellow: 70-80% | Red: <70%
- Consistent under-delivery is a leadership problem, not a team problem.
5. Cycle Time Trend
- Formula: Average days from story “in progress” to “done” — tracked over 3 sprints
- Green: Flat or decreasing | Yellow: +10-20% | Red: >20% increase for 3 consecutive sprints
- Rising cycle time = growing inefficiency. Catch it early.
6. Rework Rate
- Formula: (Stories reopened after “done” / Total stories completed) × 100
- Green: <10% | Yellow: 10-20% | Red: >20%
- High rework means Definition of Done is unclear or quality standards are slipping.
Team Stability
7. Unplanned Attrition Rate
- Formula: (Devs who left with <30 days notice / Total devs) × 100 (quarterly)
- Green: <5% | Yellow: 5-10% | Red: >10%
- Surprise departures are the #1 killer of offshore project momentum.
8. Key Person Dependency
- Formula: (% of codebase only 1 person has touched in last 6 months)
- Green: <15% | Yellow: 15-30% | Red: >30%
- If one person leaves and takes 30% of institutional knowledge, you’re in trouble.
9. Onboarding Velocity
- Formula: Days from new dev start to first meaningful commit (not just commit, but something merged to main)
- Green: <14 days | Yellow: 14-21 days | Red: >21 days
- Slow onboarding = undocumented processes + knowledge silos.
Communication Quality
10. Requirement Clarification Ratio
- Formula: Average questions per user story
- Green: 2-4 questions/story | Yellow: <2 or >5 | Red: 0 questions (they’re not reading) or >7 (your specs are garbage)
- Sweet spot: 2-4 questions means they’re engaged AND your specs are clear enough to start.
11. Standup Signal-to-Noise
- Formula: (% of standup time discussing blockers vs status recitation)
- Green: >30% blockers | Yellow: 20-30% | Red: <20%
- If standups are just status recitations with no blockers raised, people are hiding problems.
12. Escalation Response Time
- Formula: Hours from blocker raised to resolution OR formal escalation
- Green: <4h | Yellow: 4-8h | Red: >8h (unresolved), >24h (unacknowledged)
- Unresolved blockers compound. A blocker raised Monday and ignored until Friday kills a sprint.
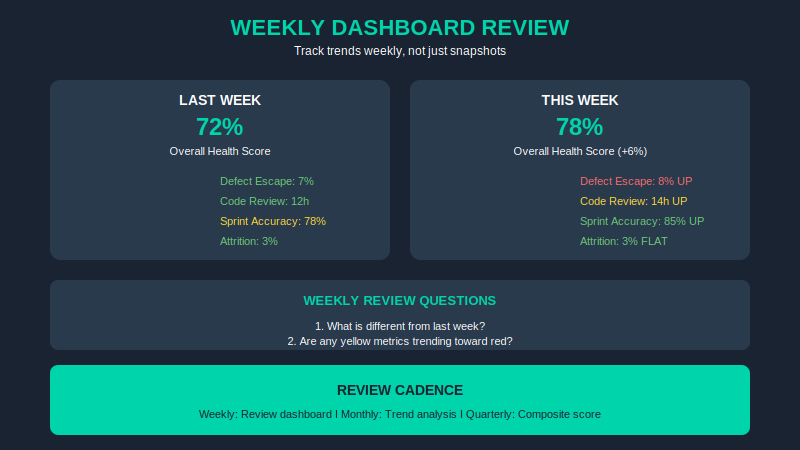
What to Measure — and How Often
This isn’t a “set it and forget it” dashboard. Here’s the cadence that actually works:
Weekly (Monday): Review dashboard. Look for any yellow or red flags. Ask: “What’s different from last week?”
Monthly: Trend analysis. Are any metrics trending in the wrong direction even if they haven’t hit yellow yet? That’s your early warning.
Quarterly: Composite health score. Weight the 12 metrics based on what’s most critical for your project. A 70/100 score might be acceptable; dropping below 60 means immediate intervention.
Implementation Timeline
You don’t need a month to set this up. Here’s what real implementation looks like:
Week 1: Set up data collection. Connect your JIRA/GitHub/GitLab. Export the metrics you can get automatically. Manually track what you can’t yet.
Week 2: Configure thresholds. Adjust the red/yellow/green values for your team size and context. A 5-person team has different norms than a 50-person team.
Week 3: First full dashboard review with your offshore team lead. Present the data. Ask: “Does this match your experience?” Usually, they already know.
Week 4: Establish cadence. Weekly reviews, monthly deep dives. Make it a standing meeting. Treat the dashboard as a leadership tool, not a report.
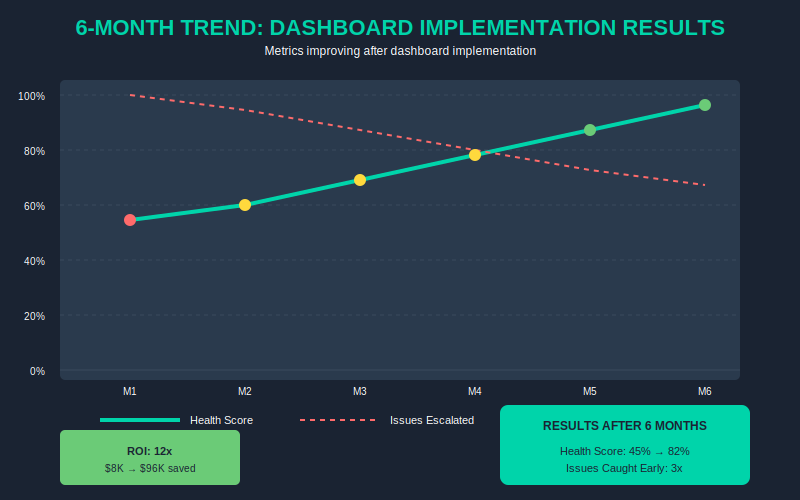
ROI Proof
Let’s do the math. Conservative math — the kind you’d present to a skeptical CFO.
The investment:
- Dashboard tooling (Jira + GitHub integrations + a simple Notion/Sheets dashboard): ~$2K setup, ~$500/month
- Configuration time: ~20 hours internal, ~10 hours with your offshore lead
- Total first year: ~$8K
The savings:
- Catching quality issues 3 months earlier saves you roughly 1 failed sprint per quarter
- Failed sprint = 2 weeks of 15 devs at $40/hr = $48,000 in wasted time
- 4 quarters × $48K = $192,000 in avoided failures
- Conservative estimate: you prevent 2 failed sprints instead of 4 = $96,000 savings
ROI: 12x in year one.
Even if your team is smaller (5 devs), you’re still looking at $32K invested vs $192K return. The numbers work at any scale.
5 Mistakes to Avoid
1. Tracking too many metrics.
Start with 4-6. The full 12 is your target, but you need to learn which ones matter most for your context. More metrics = more noise = analysis paralysis.
2. Using metrics punitively.
This dashboard is for improvement, not blame. If your offshore team sees this as a weapon, they’ll hide problems. Frame it as: “We want to catch issues before they become problems.”
3. Ignoring team stability metrics.
Code metrics mean nothing if your best devs are leaving. Unplanned attrition and key person dependency are the canaries in the coal mine — they predict failure more reliably than any code metric.
4. Not calibrating thresholds.
A 5-person team has different norms than a 50-person team. Sprint commitment accuracy of 75% might be green for a fast-moving startup but red for an enterprise delivery team. Adjust for context.
5. Reviewing monthly instead of weekly.
Problems compound. A metric that hits yellow Monday and you catch it that week = a 1-hour conversation. The same metric hits yellow and you notice a month later = a 3-week recovery project.
Next Steps
You have three paths forward. Pick the one that matches where you are:
Path 1 — DIY:
Download the Offshore Quality Dashboard Template (Google Sheets + Notion) — pre-built with all 12 metrics, thresholds, and automated scoring. Combine with this article’s framework and you’re ready to implement this week. → [Get the Template]
Path 2 — Guided:
GTCatalyst Quality Audit. We review your current offshore setup, configure your dashboard with thresholds calibrated to your team, and train your leads on the review cadence. 2-week engagement, ~$5K. → [Schedule Audit]
Path 3 — Full Service:
GTCatalyst managed teams come with this dashboard built in. Every client gets the full 12-metric dashboard, weekly reviews, and proactive intervention when metrics trend wrong. If you’re building an offshore team from scratch or rebuilding after a failure, this eliminates the guesswork. → [Learn About Managed Teams]
Related Reading
This article is part of a series on offshore team success. Here’s more:
- The $150K Hidden Tax: What Your Offshore Team Is Really Costing You — The full breakdown of offshore costs most CTOs don’t see coming
- Offshore Partner Evaluation Scorecard — 50-point framework for vetting offshore vendors before you sign
- AI-Augmented Offshore Teams: 2026 Playbook — How AI integration is changing the offshore math — and why traditional hiring is now the expensive option
If you want the complete 12-metric dashboard template with automated scoring, get it here. It’s free — no catch. Implement it this week and you’ll have visibility into your team’s health that most CTOs don’t have until it’s too late.